
Growth of Real Hourly Compensation for Production/Nonsupervisory Workers and Productivity, 1948–2011

Is America in the throes of a class war?
Look at the chart and decide for yourself. It’s all there in black and white, and you don’t need to be an economist to figure it out.
The fact is, the 1 percenters have done better under Obama than they did under Bush. Check this out from Naked Capitalism:

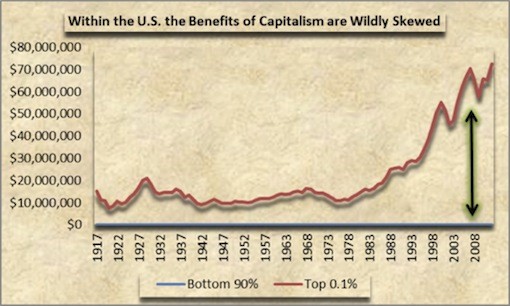
Graph (4) above: the blue line across the
bottom of the graph represents the wealth of the bottom 90% of U.S.
households. The red line represents the wealth of the richest 0.1%.
Source: Emmanuel Saez (The Climate Crisis is Capitalism, Rob Urie, CounterPunch)
Graph: Compensation of Employees, Received: Wage and Salary Disbursements/Gross Domestic Product
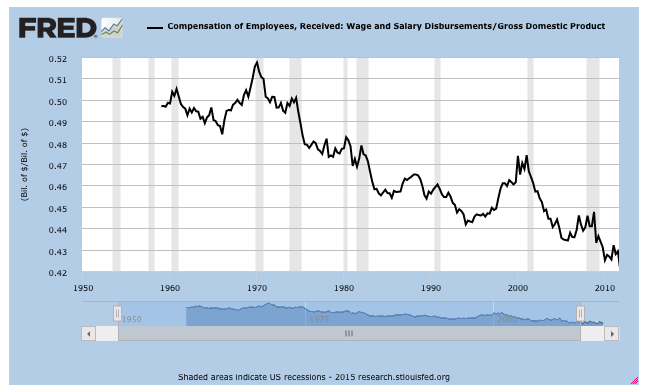
The only people who own stocks are the rich and the very, very rich Take a look:

(The Great Economic Misdirection, Rob Urie, CounterPunch)
Average income growth in US recoveries: top 10% versus the bottom 90%. (Graph: Pavlina Tcherneva)
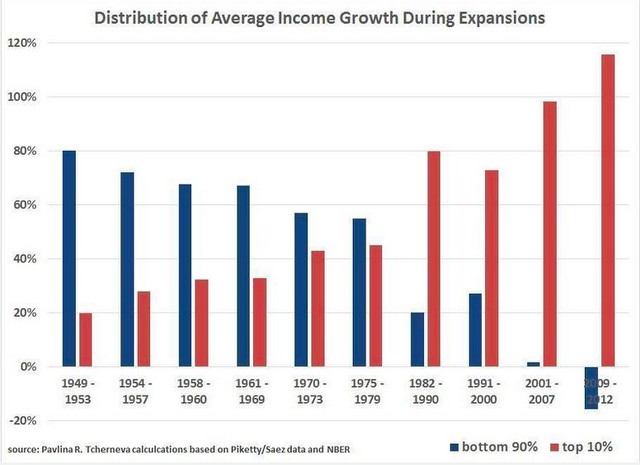
You can see from the chart above that the bottom 90 percent have gone from treading water to sinking like a stone.
from here with the lengthy explanations too
1 comment:
It was necessary for real wages to fall behind the productivity increases in order to combat the tendency of the rate of profit to fall.
Post a Comment